Dixon-Coles
A football model that shows its working, and doesn't trust itself too much.
See the live site ↗Code on GitHub ↗
- Type
- Personal project, live
- Role
- Model, data pipeline and dashboard design (solo)
- Tools
- Python, GitHub Actions, HTML/CSS/JS, Claude Code
- Note
- It's a working product that updates itself every day. But this page doesn't claim the model beats the market. That still has to be proven with real numbers.
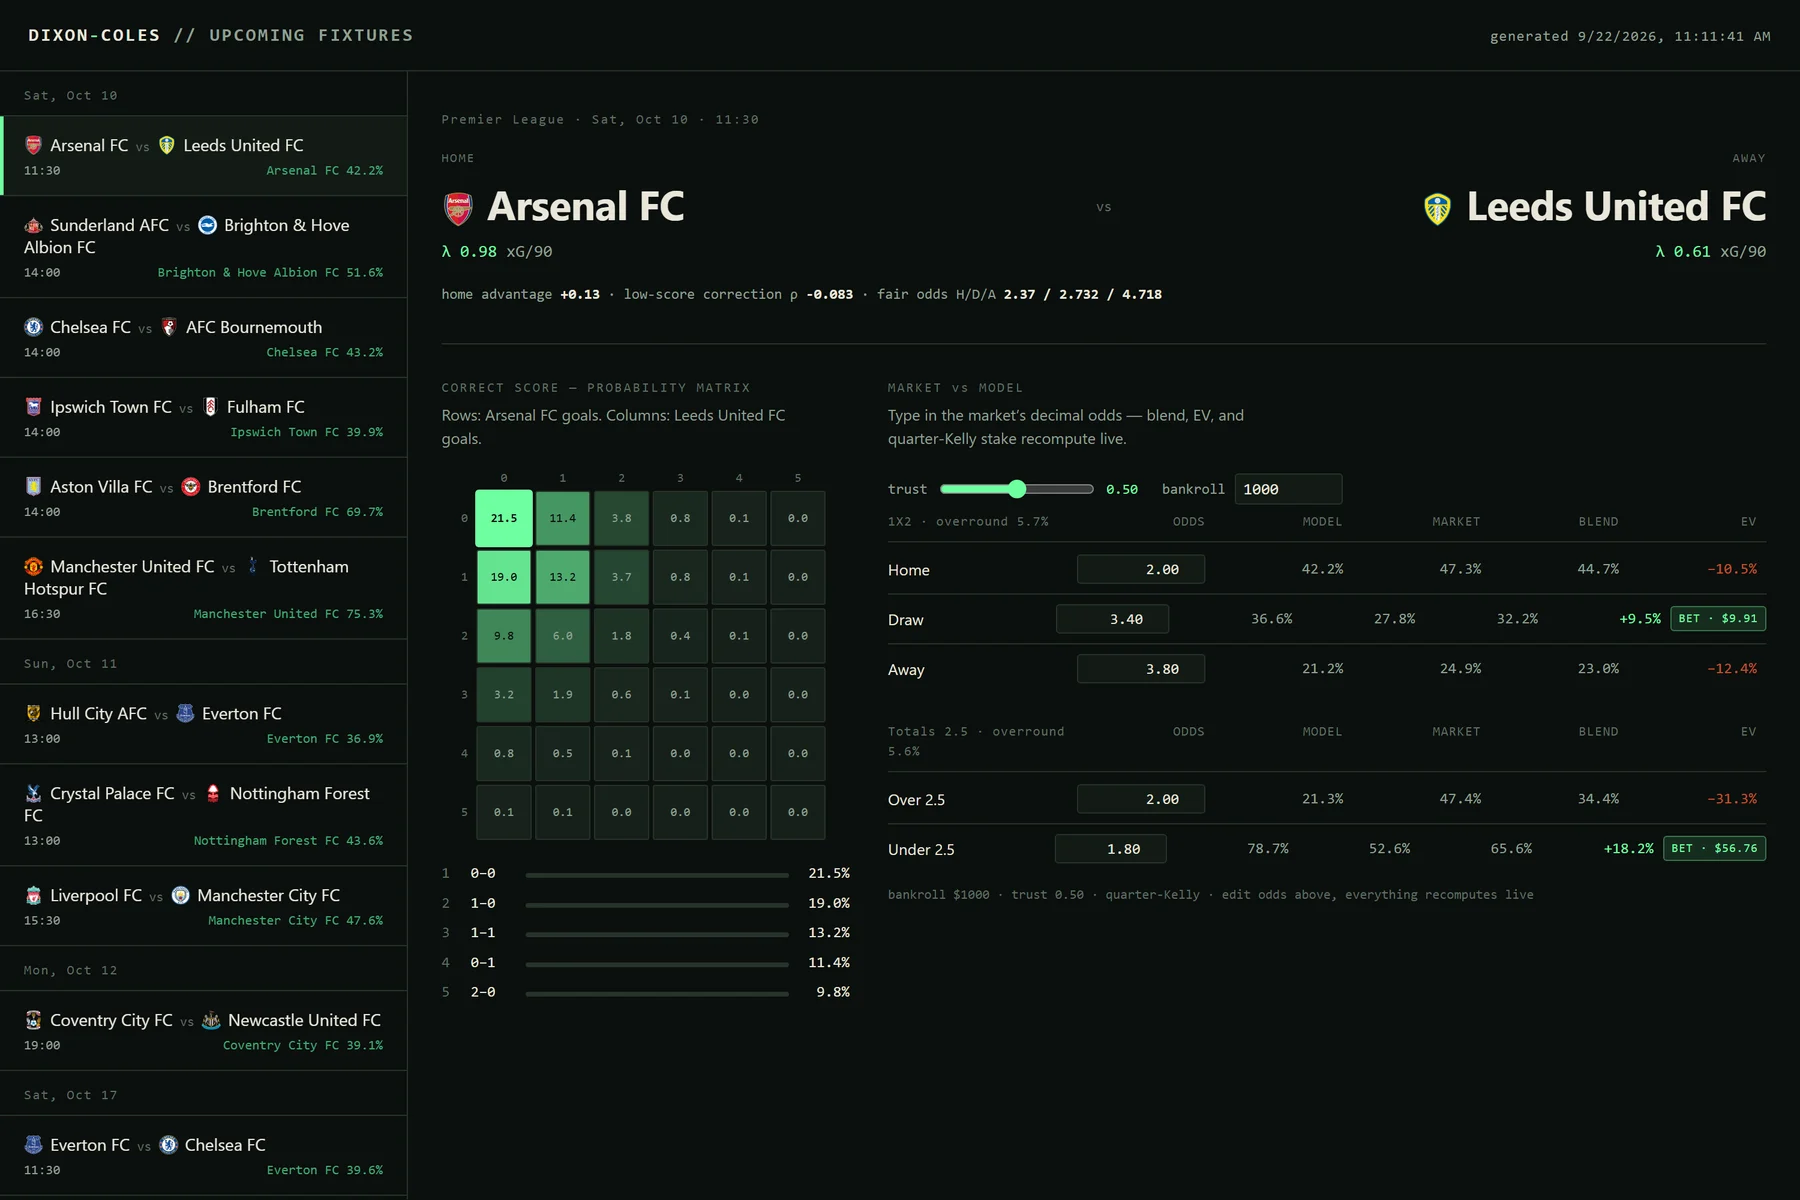
Dixon-Coles is a football prediction model with a live dashboard. Every morning it pulls the latest Premier League results and upcoming fixtures on its own, works out how likely every scoreline is for each match, and shows you what a fair price would be. Then you type in the bookmaker's odds and it tells you whether there's any value there at all. The whole thing, from the model to the data pipeline to the screen, was mine. The code was written with the help of vibe coding tools.
The core idea
Most football prediction sites give you one thing: a pick. Arsenal to win, 72% confidence. You have no way to check where that number came from, and nothing stops you from treating it like a fact.
I wanted the opposite. Dixon-Coles is a well known statistical model from 1997: it estimates each team's attacking and defensive strength, and from those it builds a full table of probabilities for every possible score. Every other number on the page (who wins, over or under 2.5 goals, the fair odds) comes from that one table.
So the idea behind the whole screen came down to one sentence:
The market is usually right. The model's job is to find the few places where it isn't.
That sentence changes what the product has to be. If you think your model is smarter than the market, you build something that shouts picks. But if you think the market is smart, you build something that compares: it puts the model and the market side by side, and it's careful about the gap between them.
How it works
The whole pipeline is one chain: match results and expected goals (xG) from Understat → the Dixon-Coles model → a score matrix → fair odds → expected value and stake size against the market → closing line value (CLV) tracking.
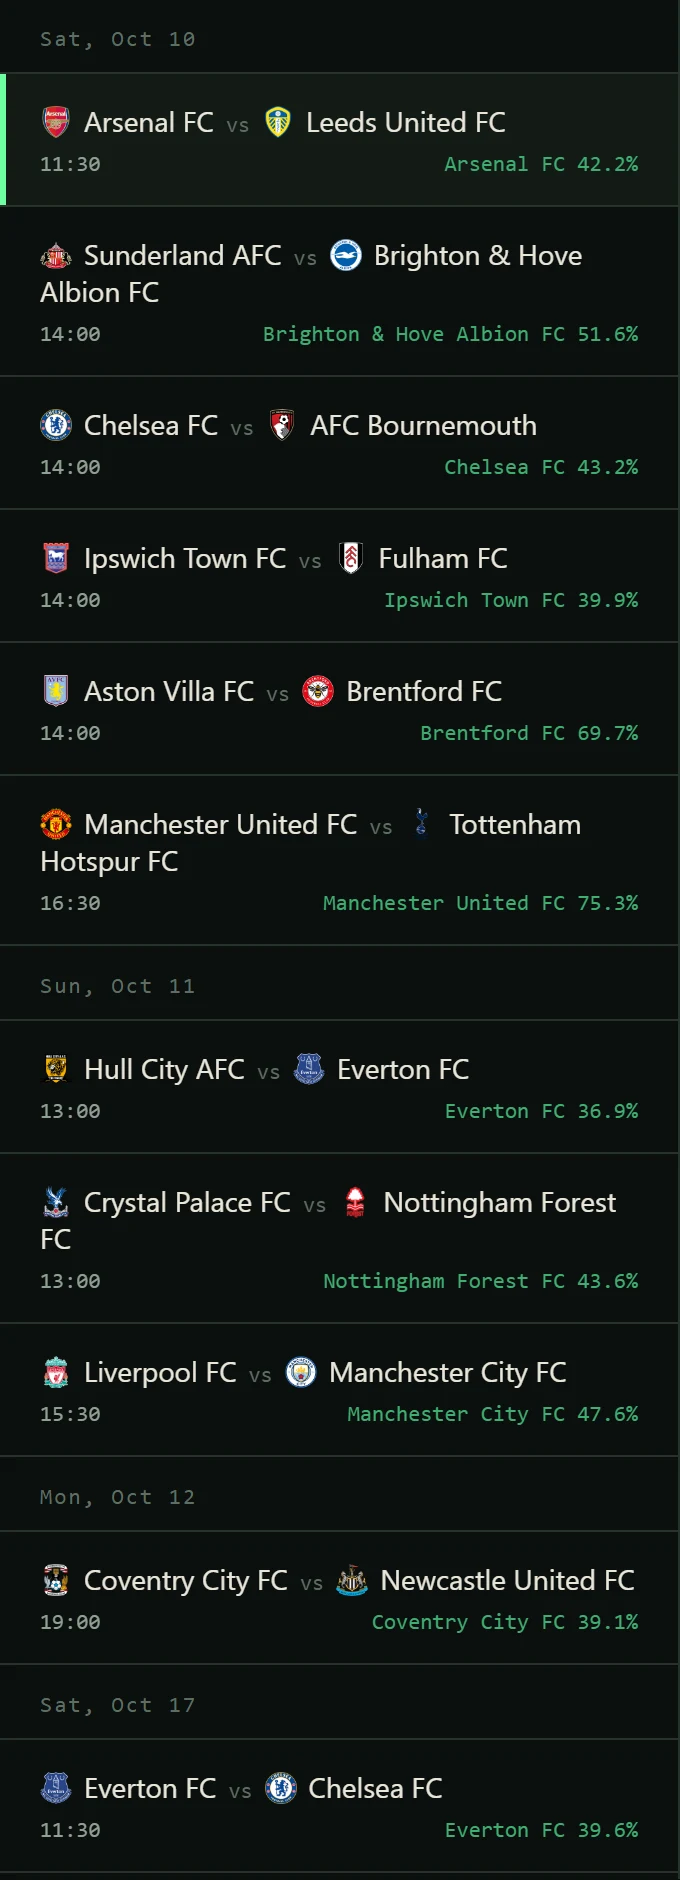
It runs without me. A GitHub Actions job runs every morning at 06:00 UTC. It pulls this season's results and xG, gets upcoming fixtures from football-data.org, fits the model again, and publishes a fresh data file for the site. If nothing has changed, it doesn't commit anything.
Recent matches count more. The model mixes real goals with xG, and older matches slowly lose weight. A team that was strong in August but has been falling apart since then shouldn't be priced on its August form.
I checked the model before trusting it. A test simulates a whole season with team strengths I chose myself, then checks whether the model can recover them. If the correlation drops well below about 0.95, something in the model is broken.
Three decisions
1. Show the whole table, not just the pick.
The simple version of this page is one line per match: who wins and by how much. It's clean, and it's what every competitor does.
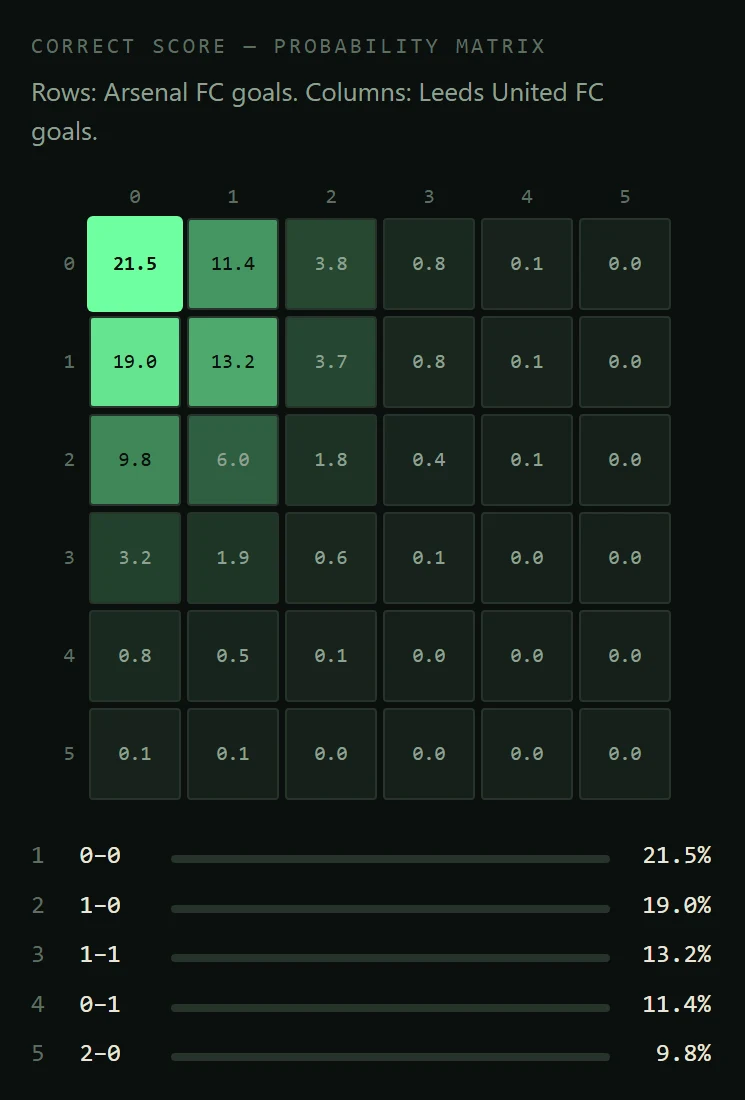
Instead I show the full 6×6 score matrix, with the most likely score highlighted and the top five scorelines listed below it. The reason is trust. When you can see that 0-0 is 21% and 1-0 is 19%, you understand why the model says the home team is only a slight favourite, and why “under 2.5 goals” comes out so likely. The pick stops being a claim and becomes something you can check.
The cost: the screen is denser, and someone who has never seen a score matrix has to work a little to read it. That's why the colour does most of the work: the brighter the cell, the more likely the score. You can get the gist without reading a single number.
2. You type in the market's odds yourself.
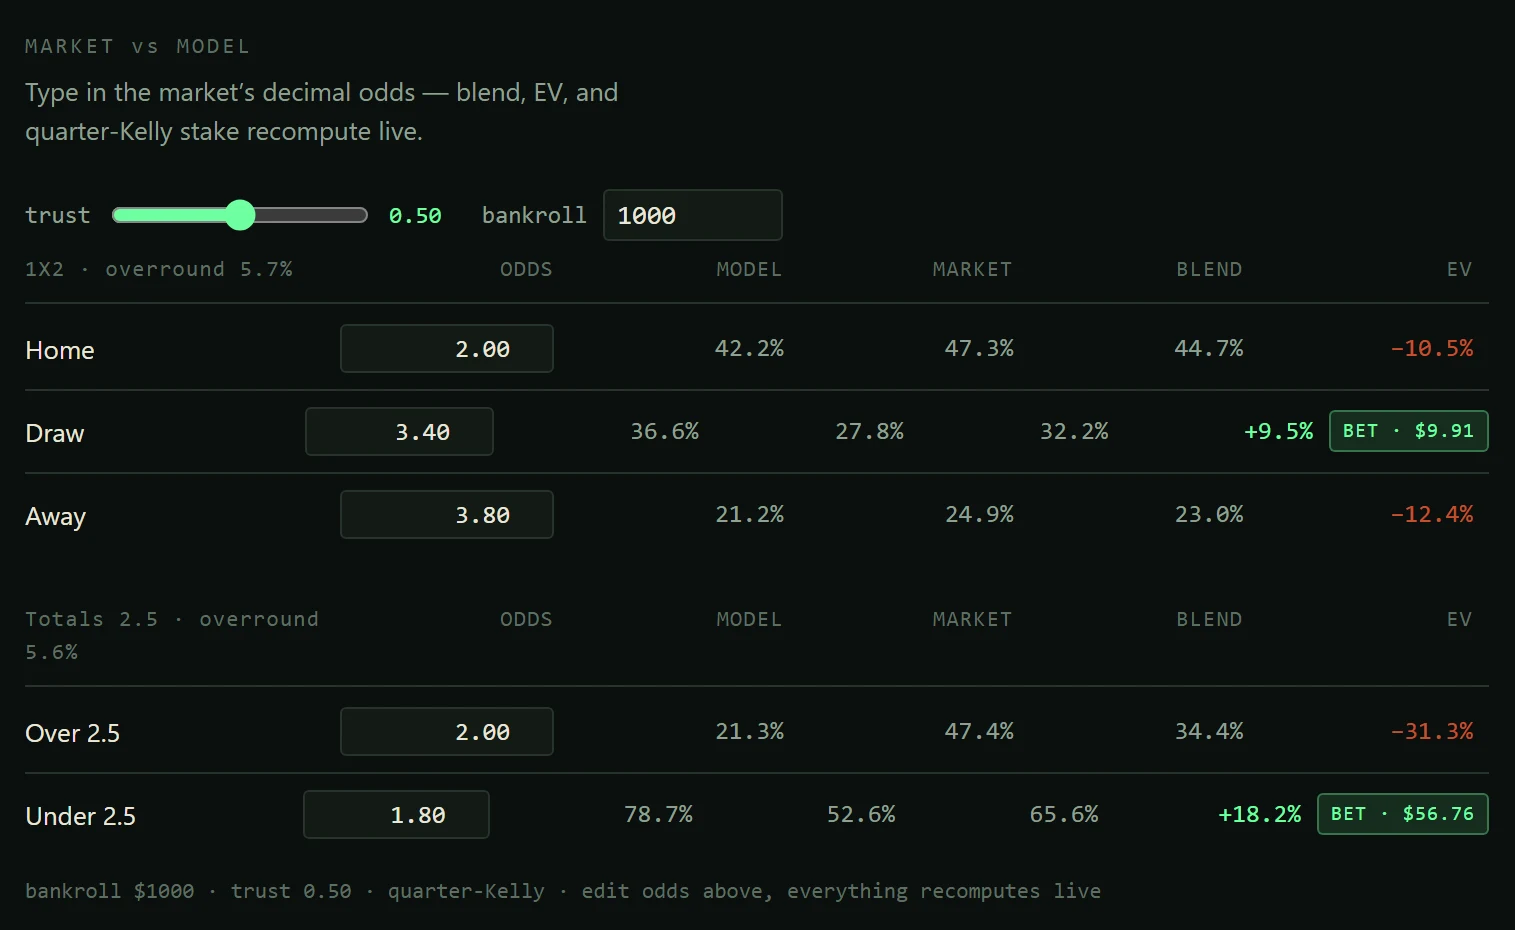
The obvious move is to pull bookmaker odds automatically and show the “bets” ready made. I deliberately didn't. The data file has no market odds in it at all; the site asks you for them, and everything is calculated live in the browser as you type.
Odds move all day. A number that was fetched this morning but looks live is worse than an empty box, because it looks like the truth. When you type in the price in front of you right now, the comparison is always about the real bet you're looking at.
The cost: it's extra work, and nobody can just open the page and scroll through a list of bets. For a tool like this, I think that friction is a good thing.
3. The model doesn't get the final say.
A model that disagrees strongly with the market is usually missing something, like an injury, a rotated squad or stale data, rather than finding a gift. So the page never trusts the model on its own. It first removes the bookmaker's margin from the odds, then blends the model's probability with the market's using a trust slider, which starts at 50/50. Expected value and the stake are worked out from that blend, not from the model alone.
The stake is sized with quarter-Kelly, a deliberately careful version of a standard formula. The numbers look absurdly small, and that's the point. And the rule I set for myself is: the slider only goes up once tracked closing line value has earned it.
The cost: fewer rows get a “bet” flag, and the edges that do show up are smaller. A product that wants to impress you would do the opposite. This one wants to keep you from making the mistakes it makes easy.
Interface
The look takes its cue from a trading terminal: a dark background, a monospaced font and numbers that line up in columns, so you can compare down a column without your eye jumping around. Colour is only used where it means something. Green is for a positive edge and a bet flag, a brick red is for a negative edge, and everything else stays muted.
Honest limits
Whether the model actually beats the market isn't shown on this page. The only honest test for that is closing line value over about 200 bets, starting with paper trading and no money at all. A few good results prove nothing either way.
It only covers the Premier League. The pipeline can fetch other leagues, but the live site only runs one.
And the interface has problems I can see myself. The calculator starts with example odds, so the very first thing a visitor sees is a “bet” flag based on numbers nobody typed in. On rows that get a flag, the columns shift out of line. And on a phone the page scrolls sideways, because the match header and the table don't fit the width.
What I'd do differently
Start the odds boxes empty and show nothing until real numbers are typed in. It's a small change, but it goes straight to the point of the whole product: a number that looks real but isn't is the most dangerous thing on the page. I'd also design the mobile layout first, not last.
What I'd keep
The trust slider. It takes the hardest question in this whole project, how far you should believe your own model, and puts it right on the screen instead of burying it in the code. For me, that was the real design decision here.